This post is my own summary of Netflix’s tech blog post Seeing through hardware counters: a journey to threefold performance increase, written the way I understood it, with some background I added along the way. The original post is the authoritative source, so check it directly for exact figures and details.
The Problem
A Netflix service was running short on CPU, so the team scaled its nodes up 3x. Given the CPU-intensive workload, they expected throughput to scale roughly in step. Instead, they got about a 25% improvement, and tail latency got worse.
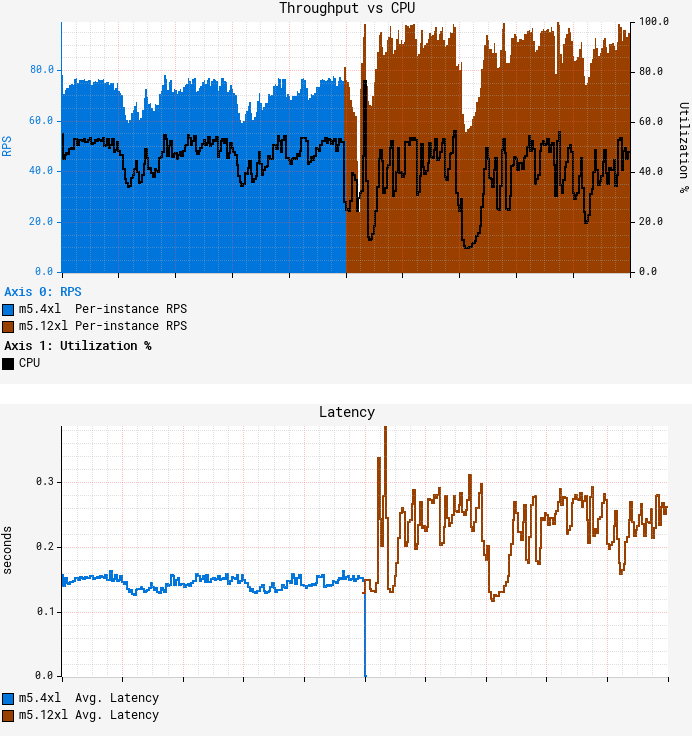
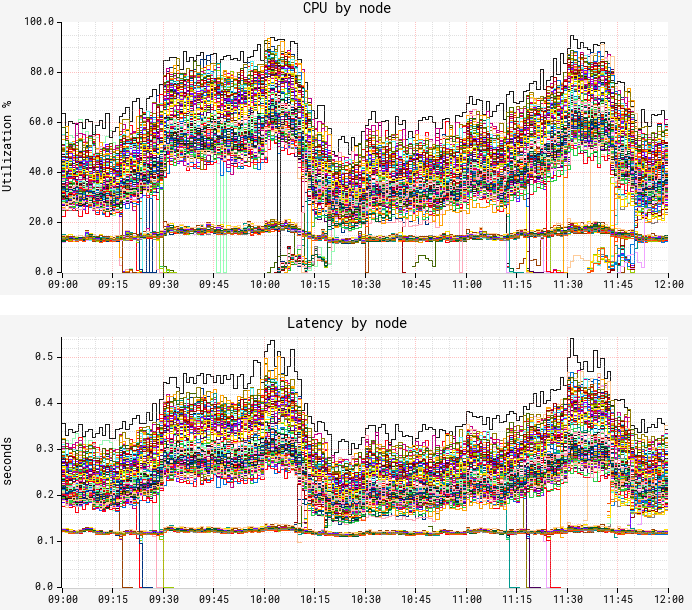
Digging further, they found CPU load varying wildly across nodes. A small slice, around 15%, ran fast. The rest, about 85%, ran noticeably slower. Since the workload was distributed round-robin, every node should have seen roughly the same throughput.
Tracking It Down
The usual tools—JVM profiling, JFR (Java Flight Recorder), and JIT compiler analysis—turned up nothing useful. The real clue only showed up once the team dropped a level lower, into CPU metrics and hardware performance counters (PMCs).
Slow nodes showed a CPI (cycles per instruction) nearly 3x higher than fast nodes. A CPI spike like that signals frequent CPU stalls. L1 and L3 cache load were also far higher, pointing to coherence-driven cache misses. MACHINE_CLEAR events were firing frequently too.
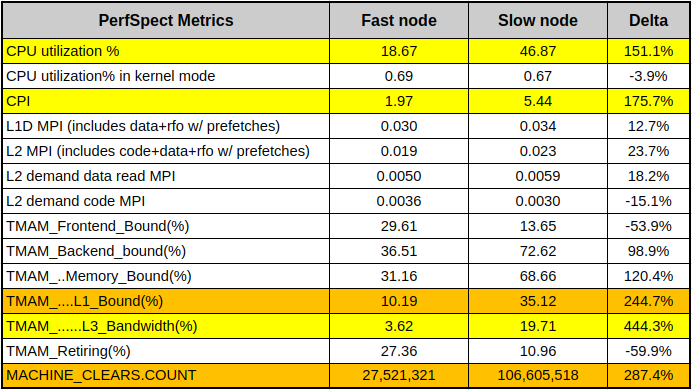
That combination, elevated CPI plus heavier cache traffic, is the textbook signature of false sharing.
What False Sharing Is
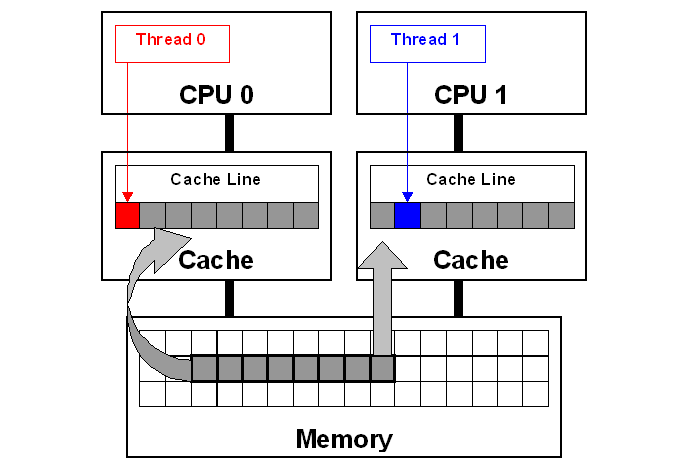
Whenever the CPU reads an address from memory, it always pulls a fixed-size chunk, typically 64 bytes. That chunk is the cache line. The trouble starts when two completely unrelated pieces of data happen to be small enough (two int32s, say) that they land next to each other in memory and end up sharing a cache line. False sharing is what happens because of that coincidental adjacency.
Picture two cores each modifying a different variable, x and y, that happen to share a cache line:
// Assume x and y are in the same cache line
int x = 0;
int y = 0;

// Thread 1
for (int i = 0; i < 1000; ++i) {
    x++;
}

// Thread 2
for (int i = 0; i < 1000; ++i) {
    y++;
}
The two threads share no variables. And yet, the moment any part of a cache line changes, the cache coherence protocol invalidates the entire line. MESI, the most common such protocol, assigns each cache line one of four states: Modified (the newest value, held by this core; memory may be stale), Exclusive (held only by this core, unmodified), Shared (held read-only by multiple cores), and Invalid (not in this core’s cache). Writing requires M or E. When a core requests ownership (an RFO), the interconnect relays that request and every other core holding the line flips it to Invalid.
So when thread 1 modifies x, thread 2 has to drop its L1 copy of that cache line and re-fetch from L3. That’s false sharing.
Once false sharing kicks in, cache invalidation drives up CPU stalls and CPI, and the constant emptying and refilling of the cache pushes up L1/L3 bandwidth. That’s exactly what Netflix observed.
Finding the Culprit and Fixing It
To find the actual offending code, the team ran CPU instruction profiling and found an instruction with a CPI over 100. The culprit turned out to be two variables the JVM uses internally to speed up subtype checks: secondary_supers_addr and secondary_super_cache. The optimization technique itself is described in Fast Subtype Checking in the HotSpot JVM.
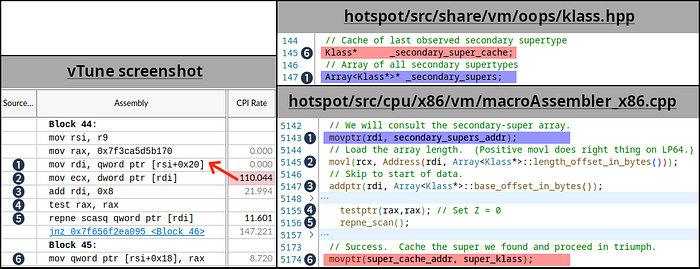
The fix was to pad the two variables 64 bytes apart, forcing them onto separate cache lines.
int x __attribute__((aligned(64)));
int y __attribute__((aligned(64)));
If a compiler hint like that isn’t an option, you can get the same effect by inserting a dummy buffer between the fields in a struct:
struct {
    int x;
    char padding[64]; // Ensures x and y are on different cache lines
    int y;
} vars;
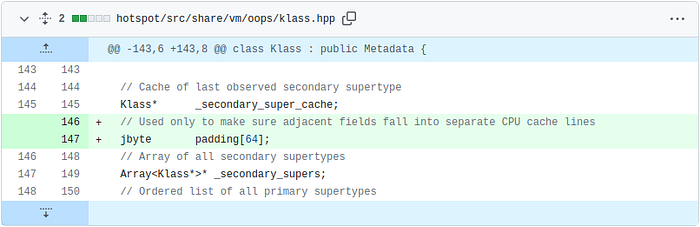
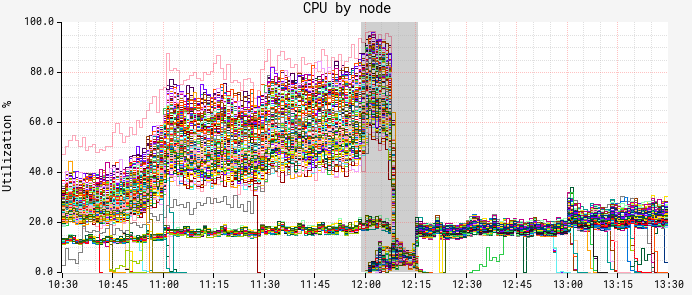
Once the patched JDK shipped, CPU usage dropped back to normal.
A True Sharing Problem Underneath
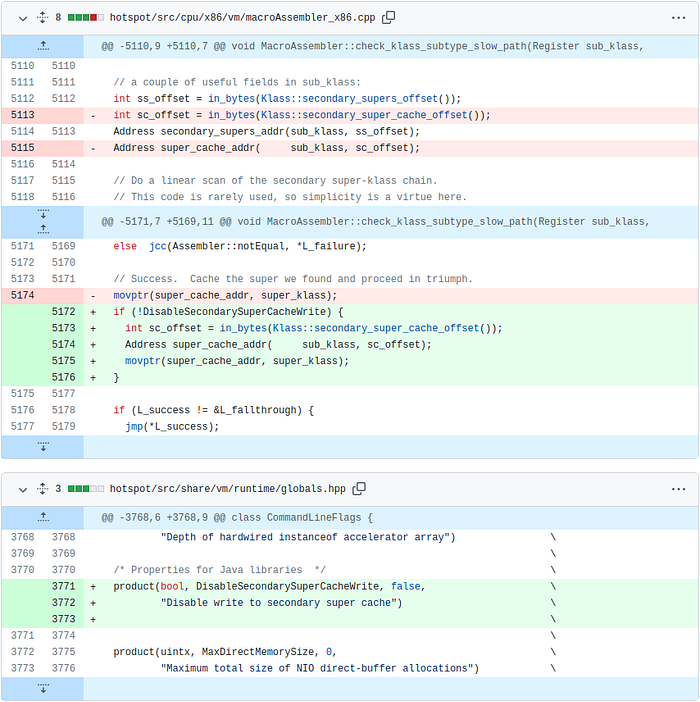
Once the false sharing bottleneck was gone, a true sharing problem surfaced. Where false sharing comes from unrelated variables that happen to land on the same cache line, true sharing comes from variables that are related, with multiple cores reading and writing them frequently at once. In other words, there was a hot shared variable underneath.
This time the culprit was a variable named super_cache_addr. Netflix’s fix was to stop caching that value entirely.
The Result
With both issues fixed, throughput and latency improved together.
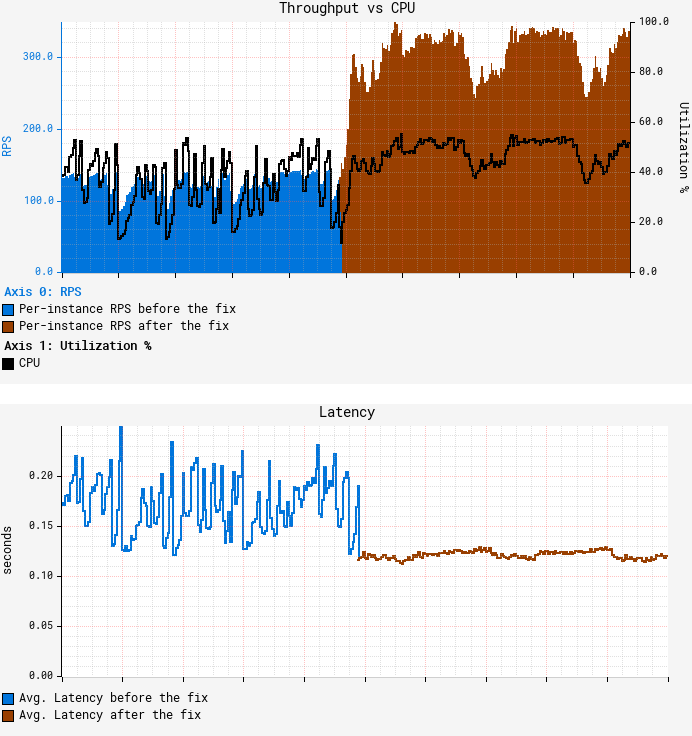
Why Only Some Nodes Were Affected
A typical cache line is 64 bytes. The two variables at fault here, _secondary_super_cache and _secondary_supers, are 8 bytes each. Treat memory layout as effectively random, and the odds that two adjacent 8-byte values land on the same 64-byte cache line come out to 87.5%. The 12.5% of nodes where the two variables happened to fall on different cache lines ran fine. The other 87.5% took the hit.
Questions I Was Left With
The original post left me with two questions.
First, why did MACHINE_CLEAR frequency also climb? The link between false sharing and rising L1 invalidations and CPU stalls is intuitive enough, but the post doesn’t make it entirely clear why false sharing would be a direct cause of the hazard behind MACHINE_CLEAR.
Second, why didn’t the same problem show up before the CPU upgrade? It makes sense that more physical cores would make false sharing worse, but that implies the same issue, only milder, should have already been present beforehand.