Discussions
Part 2: optimizing the hot path (and finding a weird villain)
“Why Objects.equals() showed up in the profile—and why SWAR beat the Vector API on ARM (and x86).
In the last post, I finally got a SwissTable-ish map running on the JVM and fast enough to make me smile. Naturally, that meant I immediately started staring at the profiler again, thinking: okay… but how do I make it faster?
This follow-up is about that next round of tuning—where the improvements come less from “big design ideas” and more from noticing one weird hotspot at a time, pulling on the thread, and ending up somewhere unexpected.
The next target: make SwissMap faster.
And the place to start was obvious: the core SIMD-ish probing loop—findIndex.
Here’s the relevant part:
@Override
protected int findIndex(Object key) {
  if (size == 0) return -1;

  int h = hash(key);
  int h1 = h1(h);
  byte h2 = h2(h);

  int mask = groupMask;      // local snapshot for probe loop
  int g = h1 & mask;         // optimized modulo (h1 % nGroups)

  for (;;) {
    int base = g * GROUP_SIZE;
    long word = ctrl[g];

    int eqMask = eqMask(word, h2);
    while (eqMask != 0) {
      int idx = base + Integer.numberOfTrailingZeros(eqMask);
      if (Objects.equals(keys[idx], key)) { // <- suspicious line
        return idx;
      }
      eqMask &= eqMask - 1; // clear LSB
    }

    int emptyMask = eqMask(word, EMPTY);
    if (emptyMask != 0) {
      return -1;
    }

    g = (g + 1) & mask;
  }
}
To find the bottleneck, I built a microbenchmark around findIndex and profiled on Mac M4/ARM using XCTraceAsmProfiler.
To keep the JMH harness from dominating the samples, I used the classic trick: amplify the cost with a tight loop and mark it with @OperationsPerInvocation.
@Benchmark
@OperationsPerInvocation(LOOP)
public int swissSimd_findIndexHit_loop(SwissGetHitState s) {
  int acc = 0;
  Integer[] keys = s.keys;
  SwissSimdMap<Integer, Integer> map = s.swissSimd;

  for (int i = 0; i < LOOP; i++) {
    int v = map.findIndex(keys[i]);
    acc ^= v;
  }
  return acc;
}
1) First surprise: Integer.equals() is “weirdly” hot
The profile immediately looked… wrong.
....[HottestMethods (after inlining)]...
67.76%  ...SimdEqBenchmarkXCTrace::swissSimd_findIndexHit_loop ...
31.88%  ... java.lang.Integer::equals ...
Wait—what?
This code is supposed to be about SIMD probing. The whole point of the ctrl-byte scan is to avoid expensive key comparisons most of the time. So why is Integer.equals() eating such a huge slice of the sampled time?
Digging into the disassembly made it clearer: Objects.equals() was not getting flattened into something cheap. The call site still looked like a real virtual call boundary:
0x...: bl  #0x...   ; *invokevirtual equals
                  ; - java.util.Objects::equals@11
                  ; - SwissMap::findIndex@...
                  ; {virtual_call}
That {virtual_call} is the problem. Even if the callee is tiny, a virtual-call boundary tends to drag in overhead—most visibly, register spills to satisfy the ABI right before the branch:
str w2,  [sp, #0x48]
stp x13, x12, [sp]
stp x19, x14, [sp, #0x10]
...
bl  #0x...   ; invokevirtual equals
This is exactly the kind of thing you don’t want in the hottest path of a hash lookup.
2) Why didn’t HotSpot (C2) Compiler devirtualize Objects.equals(a, b)?
In theory, Objects.equals() is trivial:
public static boolean equals(Object a, Object b) {
  return (a == b) || (a != null && a.equals(b));
}
Normally you’d expect this to inline, then (in a monomorphic world) expect the a.equals(b) to become either:
- a direct call, or
- a guarded fast-path + inline expansion.
But HotSpot’s ability to devirtualize depends on what it knows at that call site:
- It can devirtualize if it knows the receiver’s exact type (CHA-style certainty), or
- if the receiver type profile at that bytecode location is strongly monomorphic, so it can emit “type guard → direct call / inline”.
Here’s the catch: HotSpot type profiles attach to bytecode indices (BCIs) inside the callee, not the caller. So the receiver type profile at Objects.equals@11 is a blend of every place in the program that ends up calling Objects.equals().
In one call site, a might be an Integer
In another, it might be a String
Or a Long
Or some random user type
So even if my benchmark is “all Integer, all the time,” the profile at Objects.equals@11 can easily drift into polymorphic (or worse, megamorphic) territory. And once that happens, Hotspot Compiler gets conservative: it keeps the call virtual, and my hot loop pays the price.
This kind of situation has a name: profile pollution. If you want a deeper explanation, I recommend this post: Notes on debugging HotSpot’s JIT compilation
The key idea is summarized nicely there:
Profiles are attached to particular bytecodes, this means that when we have a virtual method call site in some heavily shared code that sees a lot of different receiver types, C2 can fail to inlining such method calls. This is sometimes called profile pollution: the profile for the call is ‘polluted’ with many different receiver types.
3) The fix: stop calling Objects.equals here
SwissMap has a useful invariant: if a control byte indicates a valid candidate slot, then keys[idx] should not be null. Empty slots don’t produce candidates; candidates imply there’s a key stored.
So Objects.equals(keys[idx], key) is doing work I don’t need:
- null checks
- an extra layer of indirection
- and (critically) it moves the equals call site into a globally-shared megamorphic method (
Objects.equals)
So I rewrote it like this:
// AS-IS
if (Objects.equals(keys[idx], key)) {
  return idx;
}

// TO-BE
Object k = keys[idx];
if (k == key || k.equals(key)) {
  return idx;
}
This looks almost insultingly simple, but it changes something important:
- The
equals()call site moves intoSwissMap::findIndexitself. - The receiver is now
k = keys[idx]. - In most realistic use (and definitely in this benchmark), the receiver(e.g. the stored key) type is very stable.
- And because
kisnon-nullby invariant, the hot path gets cleaner.
In other words: I stopped asking C2 to optimize a call site that’s polluted by the whole universe and instead gave it a call site that lives right inside the hot loop with a much cleaner type profile.
4) What the assembly looked like after: type guard → fast path
After the change, the virtual call boundary disappeared, and the compiled code collapsed into what you want on a hot path: a quick type guard and then a tiny fast-path compare.
ldr  w14, [x13, #8]      ; load klass / type info for keys[idx]
cmp  w14, w17            ; compare against expected (Integer) klass
b.ne ...                 ; mismatch → slow path

ldr  w14, [x13, #0xc]    ; load Integer.value (layout-dependent, but you get the idea)
cmp  w14, w5             ; compare against key's value
b.ne ...
No {virtual_call}.
No “spill half the world to the stack, then branch to Integer::equals.”
Just: guard, load, compare.
5) Benchmark: a very real win from a tiny change
On the same benchmark setup, this simplification cut the per-invocation time by about 50.8%:
- 7.23 ns → 3.56 ns
Not bad for deleting a helper method call.
6) Next bottleneck: VectorMask.toLong() on ARM (NEON movemask pain)
Once equals() stopped dominating the profile, something else stepped forward into the spotlight: VectorMask.toLong().
If you’ve done SIMD work on x86, you’re used to having a “movemask” instruction:
PMOVMSKB/VPMOVMSKB- “pack vector comparison results into a scalar bitmask” in one go
ARM NEON doesn’t really have the same single-instruction equivalent for “byte movemask,” so HotSpot often synthesizes it as a sequence of steps. The pattern I kept seeing was:
- vector compare →
0x00/0xFFlanes - move vector lanes into GPRs
- a chain of
orr/lsr/andto compress bits into a mask
Something like:
ldr  q16, [x11, #0x10]          ; load ctrl bytes
dup  v17.16b, w6                ; broadcast h2
cmeq v17.16b, v16.16b, v17.16b  ; compare (0x00/0xFF)
neg  v17.16b, v17.16b           ; normalize (0x00/0x01)

mov  x19, v17.d[0]              ; extract to GPRs
mov  x8,  v17.d[1]

orr  x19, x19, x19, lsr #7
orr  x19, x19, x19, lsr #14
orr  x19, x19, x19, lsr #28
and  x19, x19, #0xff
...
orr  x19, x19, x8, lsl #8       ; assemble final mask
The nasty part is the true dependency chain: the same register is updated over and over, and the resulting mask is immediately consumed by the next step (numberOfTrailingZeros, index calculation, candidate loop…). That extends the critical path of the lookup.
At that point, I wasn’t “SIMD-bound” anymore. I was “mask materialization bound.”
7) Another observation: ByteVector.fromArray range checks & spills
I also noticed some suspicious stack traffic around ByteVector.fromArray: register spills that smelled like the compiler setting up for a range-check slow path:
str w1, [sp, #0x78]
stp x19, x23, [sp, #0x68]
stp x13, x11, [sp, #0x40]
str x14, [sp, #0x60]    ; *invokestatic checkIndex
And yes, fromArray does a bounds check:
@ForceInline
public static ByteVector fromArray(VectorSpecies<Byte> species, byte[] a, int offset) {
  offset = checkFromIndexSize(offset, species.length(), a.length);
  ByteSpecies vsp = (ByteSpecies) species;
  return vsp.dummyVector().fromArray0(a, offset);
}
In SwissMap, I already pad the backing array with a sentinel region specifically so that the probe loop never needs to worry about running off the end. So philosophically, that bounds check is redundant.
Practically though, turning it off isn’t a local tweak. It’s controlled by a system property (jdk.incubator.vector.VECTOR_ACCESS_OOB_CHECK), and changing it is a global decision that could affect other Vector API code in the same process. So I’m not treating that as a safe or general-purpose “optimization.”
8) I Didn’t Plan to Use SWAR, But Here We Are
So at some point I asked myself the slightly heretical question:
What if I just… don’t use the Vector API here?
That’s where SWAR (SIMD Within A Register) comes in.
SWAR is sometimes called “poor person’s SIMD,” but I don’t mean that in a dismissive way—it’s more like a practical shortcut.
Instead of reaching for vector registers, you pack several tiny lanes (bytes, in our case) into a single 64-bit word and do “vector-ish” work with plain scalar integer instructions. The neat part is that a couple of well-known arithmetic/bitwise tricks are enough to turn “byte equality” into a compact bitmask.
No vectors, no lane extraction, and—most importantly for this story—no toLong() in the middle of the hot path. It’s just one long load, a handful of ops, and you get a mask that tells you exactly which lanes matched. And if mask generation is what’s slowing you down (rather than the comparison itself), SWAR can punch well above its weight.
SIMD still tends to be the best option when the platform gives you an efficient way to do both halves of the job: compare and extract a mask. On Apple Silicon (ARM/NEON), though, the first half is usually fine while the second half can get… awkward.
SWAR changes the shape of the work: everything stays in general-purpose registers, and the “mask” you want falls out as a scalar value from the start. Yes, you give up some peak throughput on paper—but in a hash table probe loop, the thing that often matters more is critical-path latency. If SWAR shortens that path, it can end up faster where it counts.
What changes in the code (the SWAR “signature”)
Once you commit to SWAR, the implementation starts to look different in a few very recognizable ways:
- Control bytes get packed: instead of
byte[] ctrl, we store 8 control bytes perlong(GROUP_SIZE = 8). - Fingerprints are broadcasted:
h2becomes0xhhhhhhhhhhhhhhhh(same byte repeated) so we can compare all lanes at once. - Equality becomes a mask: we compute “which lanes match” using arithmetic tricks and then use
Long.numberOfTrailingZerosto pick candidate slots.
That’s basically the whole idea: load one word → compute match mask → walk candidates → advance group.
A quick note on that eqMask trick
This one-liner is doing most of the SWAR “magic”:
/**
 * Compare bytes in word against b; return packed 8-bit mask of matches.
 */
private int eqMask(long word, byte b) {
    // XOR with the broadcasted fingerprint so that matching bytes become 0 and non-matching stay non-zero.
    long x = word ^ broadcast(b);
    // Let y = (x >>> 1) | 0x80 in each byte lane.
    // - If a lane of x is 0x00, then y becomes 0x80 and (y - x) == 0x80,
    //   so the lane's MSB (0x80) is set.
    // - If a lane of x is non-zero, then (y - x) will not leave the lane's MSB
    //   set in the same reliable way for the final mask extraction.
    // Finally, AND with 0x80.. to keep only the MSB bit from each byte lane,
    // yielding one flag bit per lane at positions 7,15,23,...,63.
    long m = (((x >>> 1) | 0x8080_8080_8080_8080L) - x) & 0x8080_8080_8080_8080L;
    // Compress spaced MSBs (bits 7,15,...) into the low byte (bit0..7).
    return (int) ((m * 0x0204_0810_2040_81L) >>> 56);
}
- XOR makes matching bytes become
0x00 - The next line builds a borrow-safe per-byte “isZero” mask: it leaves
0x80set in byte lanes wherex == 0. & 0x8080...keeps just the per-byte MSB flags—one bit per lane, still spaced out at bits 7, 15, 23, …- The multiply by
0x0204_0810_2040_81is a packing trick: it “gathers” those spaced MSB bits into a single byte. - Finally,
>>> 56selects that top byte, yielding an 8-bit mask where bit i tells you whether byte lane i matched.
The important part isn’t that it’s clever—it’s that it’s scalar and produces a mask that’s already ready for numberOfTrailingZeros without any vector-to-scalar extraction dance.
9) What changed when SWAR entered the picture
In the Vector API version, the hot region had a very recognizable shape:
- load ctrl bytes into a vector register
cmeqcompare againsth2- extract a movemask
- then immediately feed that mask into
tzcnt/candidate iteration
On x86, that “extract a movemask” step maps nicely to dedicated instructions. On NEON, it tends to become a little construction project—a vector-to-scalar extraction followed by a chain of shifts/ors to compress lane results.
In the SWAR version, that entire class of work simply… isn’t there. No q registers, no lane extraction, no VectorMask.toLong() synthesis. The hot loop becomes: load one long, do scalar ops, get a scalar mask.
The SWAR fingerprint broadcast is exactly what you’d hope
The first thing I checked was whether the broadcast stays cheap. And it does.
private static long broadcast(byte b) {
    // 1. Unsigned widening
    // 2. Broadcast a single byte to all 8 byte lanes
    return (b & 0xFFL) * 0x0101010101010101L;
}
Under the hood, this works because 0x0101010101010101 is basically a “byte replicator”: multiplying an 8-bit value by this constant produces the same value in every byte lane. There’s no loop, no shifts, no per-lane insertion—just one arithmetic operation that the CPU is already good at.
In the hot region, HotSpot emits exactly what you’d want to see:
mov  x7, #0x10101010101010101
mul  x7, x5, x7          ; broadcast(h2)
So broadcast(h2) compiles into a single multiply by 0x010101..., which is basically the best-case outcome: it boils down to a single multiplication in the hot path, and we’re done.
The eqMask trick turns into a tight scalar pipeline
Here’s the most interesting part: the SWAR equality test. This corresponds to:
long x = word ^ broadcast(b);
long m = (((x >>> 1) | 0x8080_8080_8080_8080L) - x) & 0x8080_8080_8080_8080L;
return (int) ((m * 0x0204_0810_2040_81L) >>> 56);
In the hot region, you can see HotSpot building exactly that:
ldr  x21, [x21, #0x10]   ; load ctrl word (8 control bytes packed in one long)
eor  x10, x7, x21        ; x = word ^ broadcast

lsr  x11, x10, #1                   ; m = (x >>> 1)
orr  x11, x11, #0x8080808080808080  ; m |= 0x8080...
sub  x11, x11, x10                  ; m -= x
and  x11, x11, #0x8080808080808080  ; m &= 0x8080...

mul  x11, x11, <magic>   ; m * 0x0x0204...
lsr  x11, x11, #0x38     ; >>> 56, pack per-byte MSBs into a compact mask byte
A couple of things made me happy here:
The core identity survives intact: “XOR → borrow-safe per-byte zero detect → keep MSBs → pack into a byte mask”
The “pack into a mask” step is handled with a multiply+shift style packing sequence rather than a long serial OR/shift chain. That’s still a dependency chain (because it has to be), but it’s a shorter and more GPR-friendly one than “extract vector → compress bits.”
And once the mask exists, the probe loop immediately branches based on whether it’s zero:
cbz w10, <no matches>
No detours through VectorMask helpers, no extra materialization steps. It’s all sitting right there in the findIndex hot path.
10) …Okay, but did it actually get faster?
At this point I had a SWAR probe loop that looked nicer in the disassembly—fewer moving parts, no VectorMask.toLong() detour, and a tighter scalar critical path. But profiler aesthetics don’t count as performance, so I did the only reasonable thing:
I ran the benchmark.
ARM/NEON (Apple Silicon): the same findIndex, now in SWAR clothes
On my M4 + Temurin 21, the findIndex loop came in at 2.690 ns/op.
That’s down from 3.56 ns/op with the SIMD (Vector API) version — about 24.4% faster on the same benchmark.
In other words: the hot path is now short enough that the measurement is basically “how quickly can we do a probe + a couple of candidate checks,” without the earlier mask-extraction baggage dominating the profile.
…and then I tried the same thing on a Windows PC
Apple Silicon is the whole reason I went down this path, but I didn’t want this to become a one-platform party trick. So I took the same benchmark harness I had been using, and ran it again on a Windows desktop environment—the “classic” world where x86 has strong SIMD support and mask extraction is not nearly as annoying.
The result genuinely surprised me.
SWAR was supposed to be a small ARM/NEON-specific experiment—a workaround for NEON’s awkward movemask story.
But when I reran the exact same benchmark on my Windows box (AMD Ryzen 5 5600, 6C/12T), SWAR still came out ahead of the SIMD version.
Even more unexpectedly, it was faster than the “cleaned up” SIMD baseline—the one where I’d already fixed the profiling pollution and simplified the equals() path.
| put hit | put miss |
|---|---|
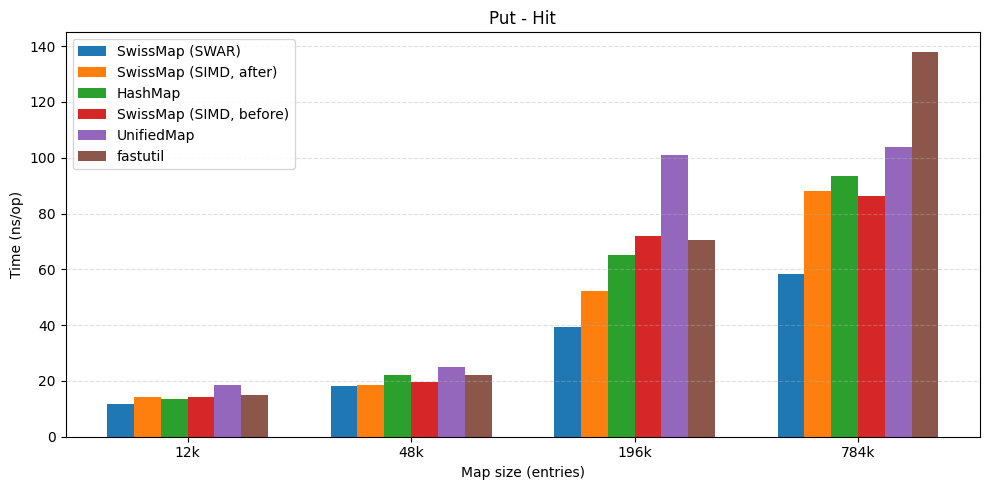 | 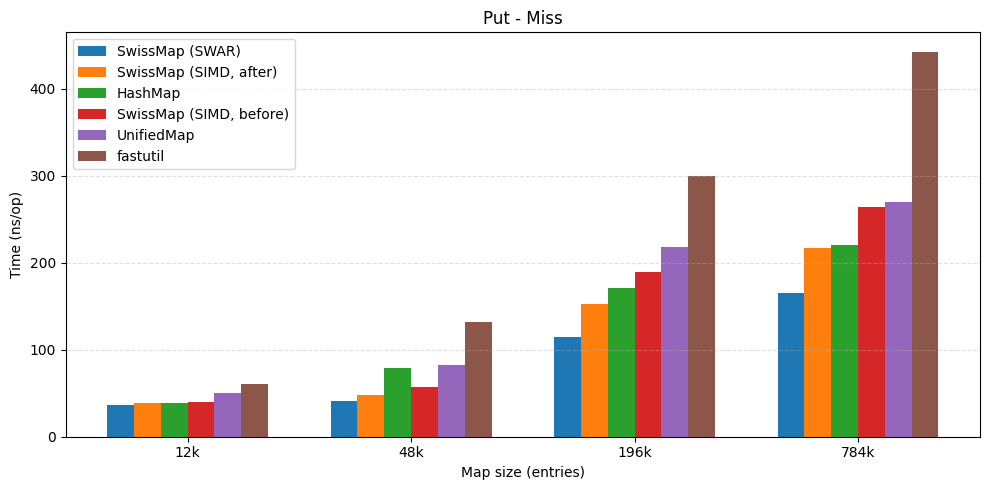 |
| get hit | get miss |
|---|---|
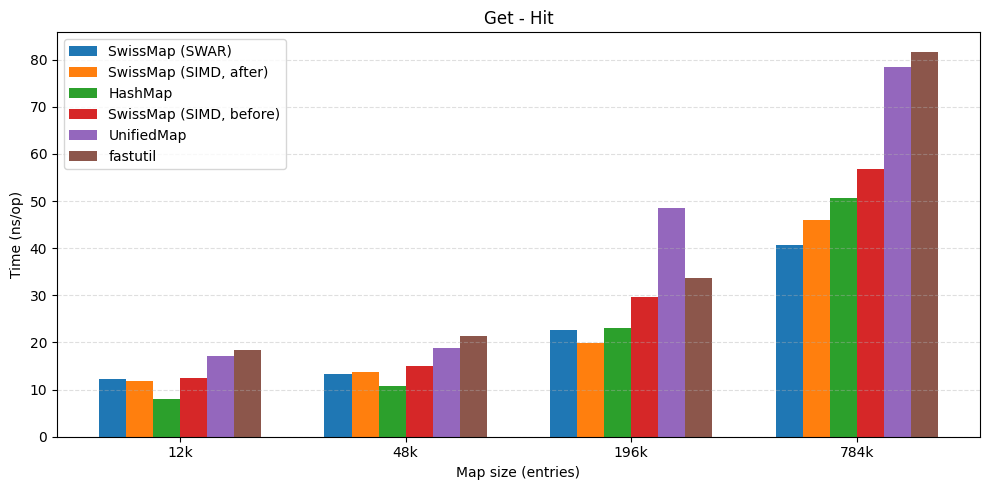 | 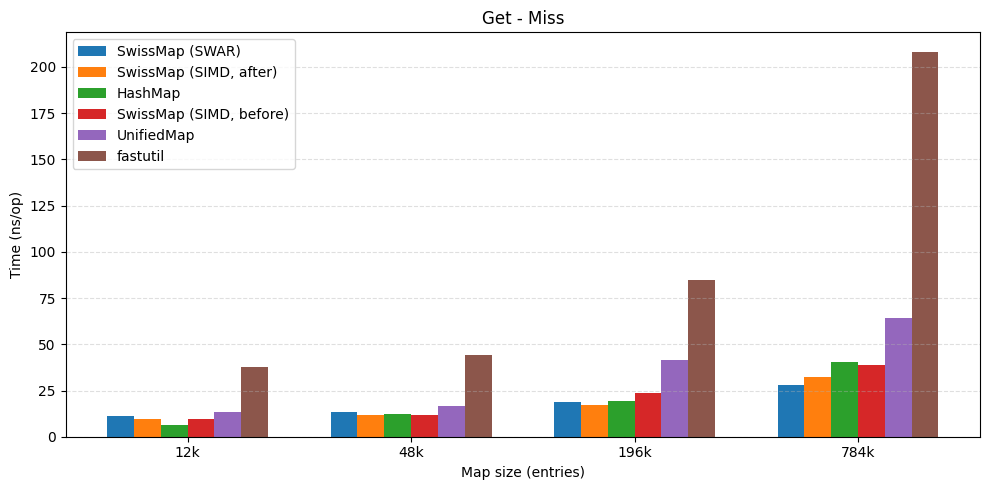 |
So for now, I’m taking the pragmatic route.
SWAR started as a “let’s see if this helps NEON” experiment, but it ended up being consistently fast across the machines I actually care about—including the one where I expected SIMD to shine. I’m not ready to claim I fully understand why it wins in every case yet (and I definitely don’t trust a single benchmark to settle an argument).
But until I can explain these results with more confidence—and reproduce them across a wider set of CPUs and JDK builds—I’m going to treat SWAR as the default implementation. It’s simple, it keeps the hot path predictable, and right now it’s the version that keeps coming back with the best numbers.
One bonus I didn’t fully appreciate until I started packaging things up: the SWAR version doesn’t require enabling the incubating Vector API at all.
That means no --add-modules=jdk.incubator.vector, no preview flags, and fewer “it works on my machine” caveats. It also makes the implementation much easier to ship on older JDKs—so even if SWAR ends up being “just a fallback” long-term, it’s a pretty convenient one to have.
P.S. If you want the code
This post is basically the narrative version of an experiment I’m building in public: HashSmith, a small collection of fast, memory-efficient hash tables for the JVM.
If you want to run the benchmarks, sanity-check an edge case, or suggest a better probe/rehash strategy, I’d love issues/PRs