Discussion: Reddit (r/java) · Hacker News
This is Part 3 of a series on building a high-performance hash table for the JVM.
- Part 1 — Building a Fast, Memory-Efficient Hash Table in Java (by borrowing the best ideas): designing a SwissTable-style map from scratch — control bytes, SWAR probing, and why open addressing beats chaining for cache locality.
- Part 2 — Further Optimizing my Java SwissTable: Profile Pollution and SWAR Probing: hunting down a surprising
Objects.equals()hotspot, and why SWAR beat the Vector API on both ARM and x86.- Part 3 (this post): handing the profiler to an AI agent — and what it found.
Part 3: letting the agent drive
At the end of the last post, I had a SwissMap that felt genuinely fast: the Objects.equals() profile pollution was gone, SWAR had beaten the Vector API on both ARM and x86, and I finally had benchmarks I was willing to trust.
Naturally, that meant I immediately started staring at the profiler again.
But this time, something was different. Rather than diving straight into the disassembly myself, I let a tool I’d been building run the experiment. The tool is called auto-optimize — a Claude Code plugin that closes the loop between profiling, planning, and measurement, autonomously.
The results: across all 8 benchmark scenarios, performance improved between 18% and 29% over the Part 2 baseline. No single dramatic change — just three smaller, compounding wins that I’m not sure I would have found in the right order on my own.
I’ll get to what auto-optimize is and how it came to be. But first, let me walk through what it actually found.
TL;DR
/auto-optimize I want to optimize the get/put performance of the SwissMap implementation.
- 1 prompt. ~3 hours of autonomous profiling, planning, and benchmarking.
- 5 experiments run. 3 optimizations landed, 2 dropped.
- 13–32% improvement across all 8 benchmark scenarios vs the Part 2 baseline.
| GetHit | GetMiss |
|---|---|
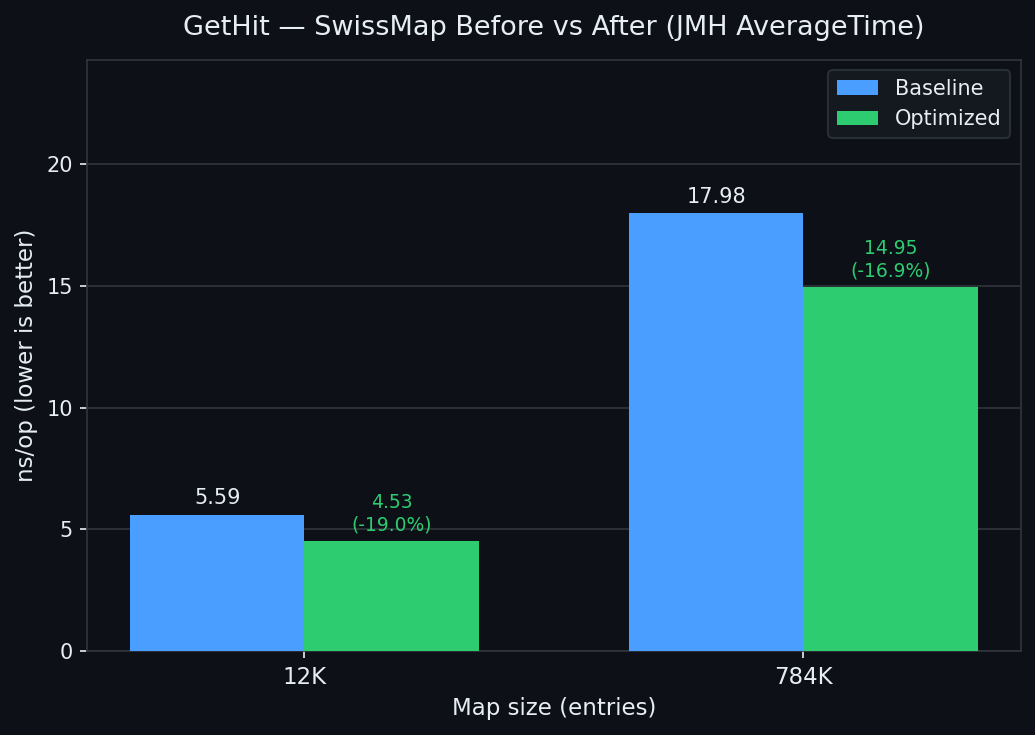 | 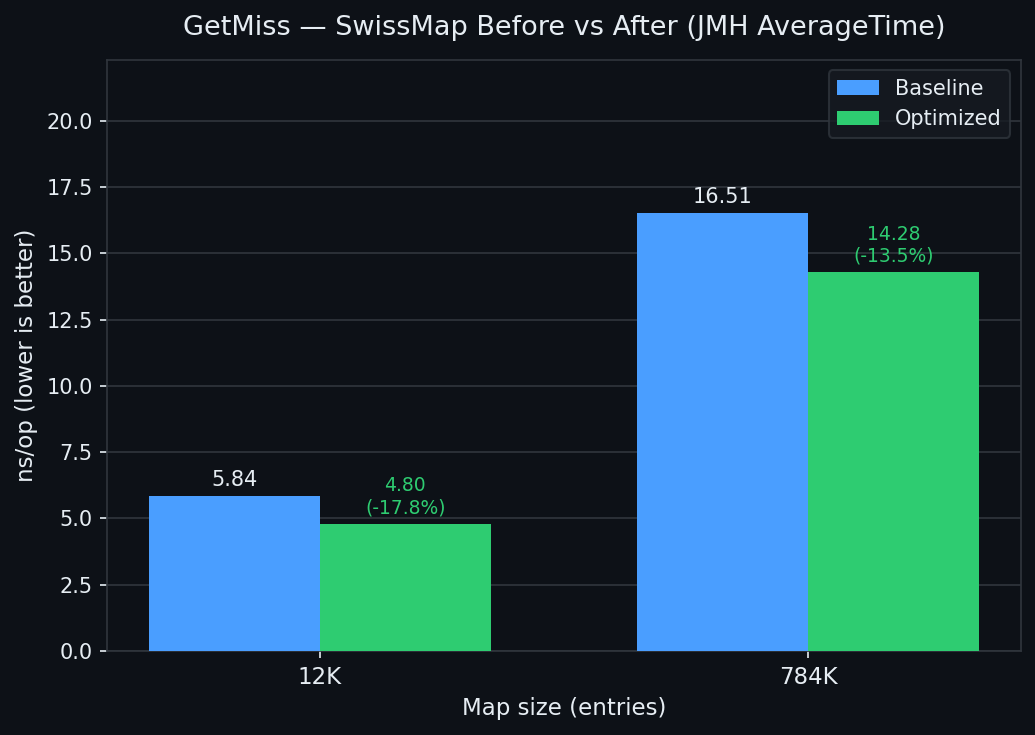 |
| PutHit | PutMiss |
|---|---|
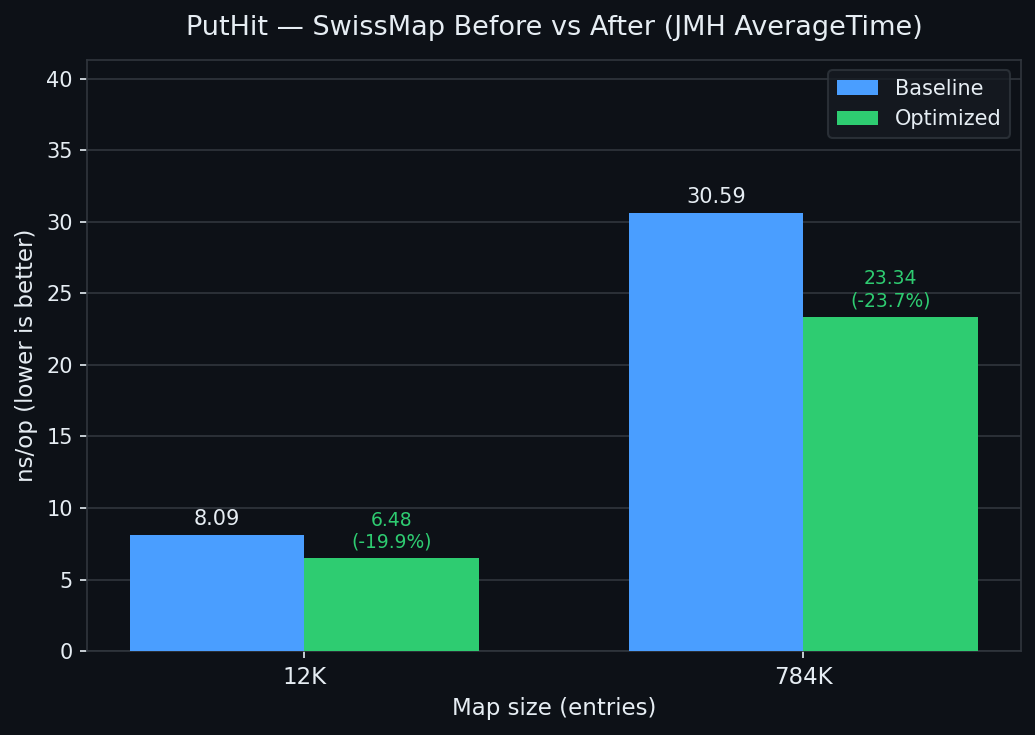 | 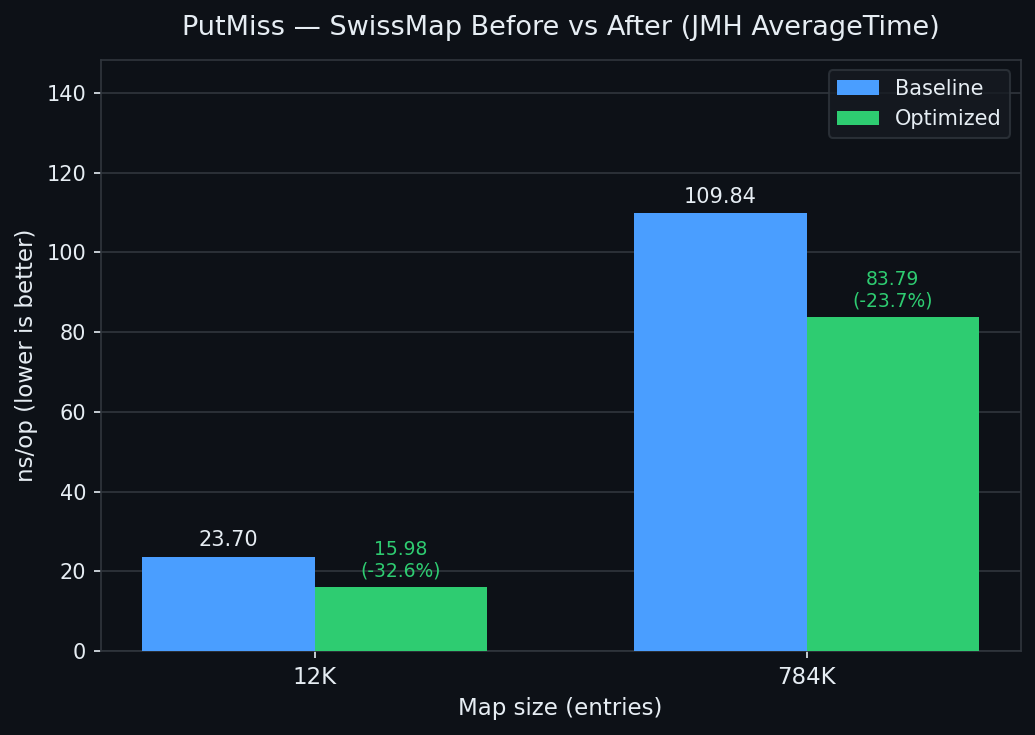 |
The setup
HashSmith is my open-source high-performance hash table project for the JVM. The experiments here all target SwissMap, the main implementation — a SWAR-based open-addressing map with 8-byte control word groups.
The baseline is the Part 2 result: the cleaned-up SWAR version with profile pollution fixed.
The benchmark matrix covers 8 scenarios: {GetHit, GetMiss, PutHit, PutMiss} × {12K, 784K}. The two sizes stress L1-resident and LLC-resident cases respectively.
| Benchmark | Baseline (ns/op) |
|---|---|
| GetHit@12K | 5.590 |
| GetHit@784K | 17.977 |
| GetMiss@12K | 5.835 |
| GetMiss@784K | 16.505 |
| PutHit@12K | 8.089 |
| PutHit@784K | 30.592 |
| PutMiss@12K | 23.701 |
| PutMiss@784K | 109.836 |
Experiment 1: tombstone guard
dropped — and a lesson in measurement
The first experiment added a single tombstones > 0 guard in putValHashed to skip the deleted-slot SWAR scan when no tombstones exist.
SwissMap tracks how many tombstone slots are live. In benchmarks that only do put without remove, tombstones is always 0 — meaning the code was computing a DELETED_BROADCAST eqMask on every probe iteration, every time, and throwing the result away. The fix was to wrap that entire block:
// Before: tombstone scan runs unconditionally
int firstTombstone = -1;
int delMask = eqMask(word, DELETED_BROADCAST);  // ← always computed
if (delMask != 0 && firstTombstone < 0) {
    firstTombstone = base + Integer.numberOfTrailingZeros(delMask);
}

// After: skip the entire block when no tombstones exist
if (tombstones > 0) {
    int firstTombstone = -1;
    int delMask = eqMask(word, DELETED_BROADCAST);
    if (delMask != 0 && firstTombstone < 0) {
        firstTombstone = base + Integer.numberOfTrailingZeros(delMask);
    }
}
One benchmark run later, auto-optimize flagged PutHit@784K as regressed by +16.5% and dropped the change.
Here’s the thing, though: that drop was probably wrong.
Looking at the error bars — PutHit@784K had massive variance across runs, and a single JMH run is not enough to distinguish signal from noise on large-table benchmarks. The change itself is logically sound: it adds exactly one boolean compare per putValHashed call. It cannot make things slower.
But auto-optimize applied its own rule: if any metric regresses more than 10%, drop it. And it did.
This is worth sitting with for a second. The agent made a defensible decision under the measurement constraints it had. The lesson wasn’t “the tool failed” — it was “a single JMH run is not enough to establish ground truth.” The tombstone idea came back in Experiment 2, this time with a more thorough treatment.
Experiment 2: tombstone fast path + ILP
Put path: -19% to -45%
Experiment 2 went further: instead of just guarding the tombstone scan, it split putValHashed into two fully-specialized loop bodies.
In most production workloads — and definitely in these benchmarks — tombstones == 0 is true essentially all the time. The existing loop was carrying dead weight on every probe iteration: tracking a firstTombstone variable, computing DELETED_BROADCAST eqMask, and branching on tombstone candidates — all work that produced nothing.
The fix was to hoist the decision outside the loop and provide two specialized bodies:
if (tombstones == 0) {
    // fast path: no tombstone tracking, no DELETED scan
    for (;;) {
        long word = ctrl[g];
        int eqMask    = eqMask(word, h2Broadcast);    // ← both computed
        int emptyMask = eqMask(word, EMPTY_BROADCAST); // ← adjacent, before key check
        while (eqMask != 0) {
            int idx = base + Integer.numberOfTrailingZeros(eqMask);
            Object k = keys[idx];
            if (k == key || k.equals(key)) { /* update */ return oldVal; }
            eqMask &= eqMask - 1;
        }
        if (emptyMask != 0) {
            int idx = base + Integer.numberOfTrailingZeros(emptyMask);
            return insertAt(idx, key, value, h2);
        }
        g = (g + 1) & mask;
    }
} else {
    // slow path: original loop with tombstone tracking (unchanged)
    ...
}
There’s a second change baked in here, and it’s worth unpacking.
Notice that emptyMask is now computed adjacent to eqMask, before the key-equality inner loop. This is ILP (instruction-level parallelism) hoisting.
Modern CPUs have an out-of-order (OOO) execution engine that can run independent instructions simultaneously. The key constraint is data dependency: if instruction B needs the result of instruction A, B has to wait. But if A and B both depend only on an already-available value, the CPU can dispatch them in the same clock cycle.
That’s exactly the situation here. In the original code, emptyMask was derived from eqMask:
// Before: emptyMask depends on eqMask → sequential
int eqMask   = eqMask(word, h2Broadcast);
// ... key-equality loop using eqMask ...
int emptyMask = eqMask(word, EMPTY_BROADCAST); // computed after the loop
But in reality, emptyMask doesn’t need eqMask at all — both only need word, which is already loaded. By hoisting emptyMask up next to eqMask, we make that independence explicit:
// After: both depend only on word → CPU can dispatch in parallel
int eqMask    = eqMask(word, h2Broadcast);
int emptyMask = eqMask(word, EMPTY_BROADCAST); // independent — runs alongside eqMask
The reason this matters is that putValHashed’s inner probe loop is a tight hot path — it repeats on every group until an empty slot is found. Pipeline stalls accumulate with every iteration, so even shaving one cycle of serial latency per probe compounds quickly across the full operation.
Results:
| Metric | Baseline | Experiment 2 | Delta |
|---|---|---|---|
| PutHit@12K | 8.089 | 6.542 | -19.1% |
| PutHit@784K | 30.592 | 24.501 | -19.9% |
| PutMiss@12K | 23.701 | 16.939 | -28.5% |
| PutMiss@784K | 109.836 | 60.594 | -44.8% |
Get metrics were unchanged — this experiment only touched putValHashed.
Experiment 3: the same ILP trick on the read path
all metrics: -11% to -36%
Once the put path was cleaned up, the next question was obvious: findIndexHashed — the read path, and the hottest method in the map — had the same structure. The same ILP opportunity was sitting there, untouched.
The original code computed emptyMask after the key-equality inner loop, far from eqMask:
// Before: emptyMask computed after the key-equality loop
for (;;) {
    long word = ctrl[g];
    int eqMask = eqMask(word, h2Broadcast);

    while (eqMask != 0) {           // key-equality check loop
        int idx = base + Long.numberOfTrailingZeros(eqMask);
        Object k = keys[idx];
        if (k == key || k.equals(key)) return idx;
        eqMask &= eqMask - 1;
    }

    int emptyMask = eqMask(word, EMPTY_BROADCAST);  // ← far from eqMask
    if (emptyMask != 0) return -1;
    g = (g + 1) & mask;
}
The fix: move emptyMask up, right next to eqMask:
// After: both SWAR ops adjacent — OOO CPU can pipeline them
for (;;) {
    long word = ctrl[g];
    int eqMask    = eqMask(word, h2Broadcast);
    int emptyMask = eqMask(word, EMPTY_BROADCAST);  // ← hoisted, adjacent

    while (eqMask != 0) {
        int idx = base + Long.numberOfTrailingZeros(eqMask);
        Object k = keys[idx];
        if (k == key || k.equals(key)) return idx;
        eqMask &= eqMask - 1;
    }

    if (emptyMask != 0) return -1;
    g = (g + 1) & mask;
}
Results — the first time Get metrics improved at all:
| Metric | Baseline | Experiment 3 | Delta |
|---|---|---|---|
| GetHit@12K | 5.590 | 4.946 | -11.5% |
| GetHit@784K | 17.977 | 15.763 | -12.3% |
| GetMiss@12K | 5.835 | 5.008 | -14.2% |
| GetMiss@784K | 16.505 | 14.276 | -13.5% |
| PutMiss@784K | 109.836 | 69.910 | -36.4% |
Experiment 4: the counterintuitive one
GetHit: -21% to -27%
Experiment 3 left findIndexHashed in a state that felt clean: both SWAR operations adjacent, ILP available, the CPU doing two things at once. It seemed like the right shape.
Experiment 4 undid part of that — and got faster.
The insight: on a typical hit, eqMask is non-zero on the first probe group. The map only needs emptyMask on the cold path: when no h2 match was found and we need to decide whether to advance or terminate. On the dominant first-probe hit path, emptyMask is computed eagerly and immediately discarded.
So the change was to make emptyMask lazy:
// After: emptyMask computed only on the cold path
for (;;) {
    long word = ctrl[g];
    int eqMask = eqMask(word, h2Broadcast);

    if (eqMask != 0) {
        // hot hit path: skip emptyMask entirely
        do {
            int idx = base + Long.numberOfTrailingZeros(eqMask);
            Object k = keys[idx];
            if (k == key || k.equals(key)) return idx;
            eqMask &= eqMask - 1;
        } while (eqMask != 0);
    } else {
        // cold path: no h2 match — now check for empty
        if (eqMask(word, EMPTY_BROADCAST) != 0) return -1;
    }

    g = (g + 1) & mask;
}
Wait — wasn’t Experiment 3’s ILP the whole point? If eqMask and emptyMask are independent ops on the same word, isn’t parallel better than sequential?
In theory, yes. In practice, both eqMask() calls bottom out on a 64-bit multiply. Modern CPUs — including the M4 and the Ryzen 5 I tested on — have one or two integer multiply ports. Issuing two multiplies back-to-back competes for the same port. The apparent ILP from Experiment 3 was partly cancelled by a structural hazard on the multiply unit.
By making emptyMask lazy, the multiply unit on the hot path is uncontested. The branch on eqMask != 0 is highly predictable (biased toward “yes” for hit-heavy maps). The net effect: the hot path is shorter and the CPU doesn’t stall on multiply throughput.
Results:
| Metric | Baseline | Experiment 4 | Delta vs Baseline | Delta vs Exp 3 |
|---|---|---|---|---|
| GetHit@12K | 5.590 | 4.402 | -21.2% | -11.1% |
| GetHit@784K | 17.977 | 13.056 | -27.4% | -17.2% |
| GetMiss@12K | 5.835 | 4.750 | -18.7% | -5.2% |
| GetMiss@784K | 16.505 | 13.058 | -20.9% | -8.6% |
| PutHit@12K | 8.089 | 6.428 | -20.5% | -4.1% |
| PutHit@784K | 30.592 | 21.602 | -29.4% | -9.4% |
| PutMiss@12K | 23.701 | 17.601 | -25.7% | — |
| PutMiss@784K | 109.836 | 79.756 | -27.4% | — |
Every metric improved 18–29% vs the Part 2 baseline.
Experiment 5: cold-path split
dropped — and a lesson about method boundaries
Experiment 4 left putValHashed in a clean state. The hot probe loop handled hit detection; the tombstone tracking and insertion logic ran after. It worked. But the loop body still carried several live variables: firstTombstone, DELETED_BROADCAST, the tombstone branch, the insertAt call. The idea for Experiment 5 was simple: what if the JIT had less to worry about?
The change extracted the entire miss path — tombstone scan and insertAt — into a separate private method:
private V putValHashed(K key, V value, int smearedHash) {
    // ... setup ...
    for (;;) {
        long word = ctrl[g];
        int base = g << 3;
        int eqM = eqMask(word, h2Broadcast);
        long emptyBits = hasEmpty(word);
        while (eqM != 0) {
            int idx = base + Integer.numberOfTrailingZeros(eqM);
            Object k = keys[idx];
            if (k == key || k.equals(key)) {
                V old = castValue(vals[idx]);
                vals[idx] = value;
                return old;
            }
            eqM &= eqM - 1;
        }
        if (emptyBits != 0) {
            int emptyIdx = base + (Long.numberOfTrailingZeros(emptyBits) >>> 3);
            return putMiss(key, value, h2, h1, mask, emptyIdx, step, g); // ← cold path
        }
        g = (g + (++step)) & mask;
    }
}

// Cold path: tombstone tracking + insertAt, compiled separately
private V putMiss(K key, V value, byte h2, int h1, int mask,
                  int emptyIdx, int probeStep, int emptyGroup) { ... }
The hot loop now had fewer live variables. No firstTombstone int, no DELETED_BROADCAST scan, no tombstone branch. The JIT should have more room to allocate registers freely for the hit path.
Results:
| Metric | Baseline | Experiment 5 | Delta |
|---|---|---|---|
| PutHit@12K | 7.921 | 9.223 | +16.4% |
| PutHit@784K | 28.689 | 32.070 | +11.8% |
| PutMiss@12K | 18.443 | 18.657 | +1.2% |
| PutMiss@784K | 112.932 | 76.356 | -32.4% |
Both PutHit metrics regressed more than 10% — auto-optimize reverted immediately.
Here’s what actually happened. The ILP gain from Experiment 2 — eqMask and emptyBits computed adjacent, independent, dispatched in parallel — only works when the entire putValHashed method is one compilation unit. The moment a method boundary was introduced, two things broke it.
First: setting up the putMiss call required moving 8 arguments into registers. Java’s JIT calling convention places arguments in registers, and 8 arguments is enough that some spill to the stack. That register movement competed directly with the slots being used for the ILP operations in the loop.
Second: even if the JIT decided to inline putMiss, the call-site setup was enough to disrupt the register allocation the JIT had built for the hit path.
The lesson: the ILP gain from Experiment 2 is method-boundary-sensitive. It only survives as long as the probe loop and its context stay in the same compilation unit. Introducing a call — even a potentially-inlined one — changes the JIT’s view of the live variable set and can undo earlier wins.
There’s a silver lining: PutMiss@784K improved by 32.4%. Separating the tombstone logic does help the miss path — it’s just that the method call overhead wrecked the hit path. The tombstone specialization idea is still valid; it needs an approach that doesn’t introduce a call site on the hot path.
Where did auto-optimize come in?
All four of these experiments were run by auto-optimize — a Claude Code plugin I’ve been building that applies an autonomous profile → plan → execute → measure → reflect loop to performance engineering problems.
The way it works: you give it a numeric goal, a success threshold, and the commands to run tests and benchmarks. It asks a few clarifying questions, then locks a noise-floor-validated baseline. After that, it loops.
Each iteration looks roughly like this:
- Profile the current codebase to find where time is actually going — and check whether the bottleneck has shifted since the last experiment.
- Plan using a structured reasoning pipeline: Step-Back (what kind of bottleneck is this?), Chain-of-Thought (enumerate at least 3 strategies with explicit trade-offs), Self-Consistency (re-evaluate the candidates independently, as if seeing them for the first time), and Pre-mortem (assume the plan already failed — why?).
- Apply the change. Run the regression tests. If they break, revert and write down what happened.
- Benchmark against the locked baseline. If any metric regresses beyond the threshold, drop the change.
- Reflect: write a
reflexion.md— not a summary, but concrete lessons and specific hints for the next iteration.
The next iteration reads that reflexion before it does anything.
Every experiment is a git commit. Every plan, every benchmark result, every reflexion is written to experiments/ and stays there — whether the change landed or got dropped. The full history is always recoverable.
For the HashSmith experiment, that meant: five iterations, five commits, two dropped changes and three that stuck. The plans that reasoned about tombstone state, multiply port contention, and lazy evaluation — those came from step 2. The drops came from step 4. The connections between experiments came from step 5.
Which raises the obvious question: why does this exist?
The origin: Andrej Karpathy’s autoresearch
Recently I came across Andrej Karpathy’s autoresearch — a project that closes the hypothesis-experiment-reflection loop so an AI agent can drive an entire research cycle autonomously.
The idea genuinely impressed me. Not just as a technical demo, but as a statement about how AI should be used in research: not as a one-shot answer generator, but as a system that compounds knowledge across iterations.
I’m a performance engineer. My whole job is some variant of: measure → hypothesize → experiment → measure again. I read autoresearch and thought: this is exactly what I do. And I do it badly.
The temptation was immediate and I had no interest in resisting it: what would autoresearch look like if the domain was performance engineering, and the thing being optimized was code?
Building it: three things I got wrong
1. The agent kept rediscovering the same dead ends
Early versions of auto-optimize had no persistent experiment memory. Each experiment started from the profile and the code, with no record of what had already been tried. The agent would profile, see the same bottleneck, and propose the same strategy that was tried (and dropped) two experiments ago — with equally confident reasoning.
This wasn’t a model failure. It was a system design failure. The agent had no way to know what it had already learned.
The fix was to make reflexion mandatory and feed it forward. Every experiment now writes a reflexion.md — not a summary, but a specific set of lessons: what was surprising, what failed, what to try next. The next experiment reads this before it profiles anything. The result is that the agent accumulates experiment-specific knowledge that general-purpose AI simply doesn’t have.
2. Profiling a tree while missing the forest
The second failure mode was subtler. The agent would correctly identify a real bottleneck — say, a hot path in the probe loop — and then spend an experiment on a micro-optimization that yielded 2-3%, while a much larger gain was sitting one level up in the call stack, completely unexamined.
It wasn’t wrong. It was just… local. It was optimizing what it could see in the disassembly, not what it should have been looking at given the overall performance budget.
The fix was to build in a structured reasoning pipeline before any code is touched: Step-Back (what type of bottleneck is this, abstractly?), Chain-of-Thought (enumerate at least 3 strategies with trade-off analysis), Self-Consistency (re-evaluate independently), and Pre-mortem (assume the plan already failed — why?). Together, these force the planner to zoom out before zooming in.
The tombstone fast path (Experiment 2) is a good example of this working. The profiler pointed at the probe loop. The structured reasoning asked: what is this loop doing that it doesn’t need to do? The answer — carrying tombstone state on a path where tombstones essentially never exist — wasn’t visible in the disassembly. It required stepping back.
3. Context overflow makes agents do weird things
The third failure was messier. As experiments accumulated — profiles, disassembly, diffs, benchmark output — the main context window started to fill up. And when it did, the agent’s behavior degraded in subtle ways: it would contradict earlier decisions, lose track of what metrics mattered, or produce plans that seemed disconnected from the actual bottleneck.
It took me a while to diagnose this, because the outputs still looked coherent. The agent was still writing valid plans and valid code. It was just reasoning about the wrong problem.
The fix was to move everything into sub-agents. Each experiment now runs in a dedicated sub-agent. Raw profiling output, disassembly, diffs, and test logs never touch the main context. The orchestrator only sees a structured return value: what changed, what the benchmark showed, and what to try next. The main loop stays clean indefinitely.
In retrospect this seems obvious. But it took several experiments of increasingly bizarre agent behavior before I understood what was actually happening.
Where things stand
The current state of the HashSmith experiment is five experiments in, all metrics up 18–29%, and a growing reflexion.md trail that the next experiment will read before it touches a single line of code.
auto-optimize is available as a Claude Code plugin:
claude plugin marketplace add bluuewhale/auto-optimize
claude plugin install auto-optimize@auto-optimize
Then: /auto-optimize. Give it a goal, a benchmark command, and a success threshold. It takes it from there.
If you want to follow along with the HashSmith experiments — or try auto-optimize on your own codebase — I’d genuinely love to hear what happens. The experiment logs are all public.
The code, the plans, the dropped experiments, the noise-dominated runs that got dropped for the wrong reasons — all of it is there.
HashSmith source: github.com/bluuewhale/hash-smith
auto-optimize plugin: github.com/bluuewhale/auto-optimize